
Introduction
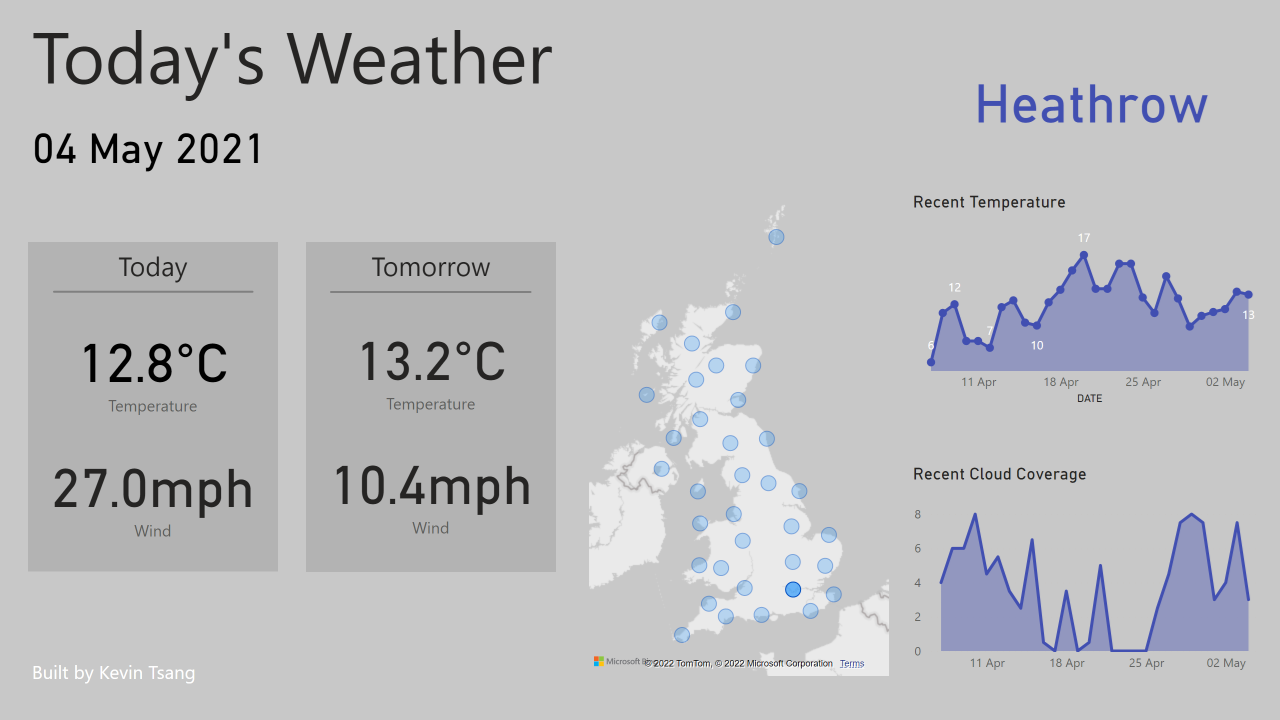
Power BI is a data visualisation tool. Here I produced a dashboard using the daily weather summaries of 2021 provided by the Met Office (based in the UK). By clicking on the different sites across the UK, you can see the weather as measured at the station.
Data Processing
There are two tables involved: one with the daily weather summaries and one with the locations of the Met Office stations. Refer to my previous post for the process to form the two datasets using R. The two tables are linked via station_name to SITE. This allows the interactive map to filter the data in the surrounding visuals.
The measure used to display the temperature card was as follows:
Max_Temp_Today = CALCULATE (
    FORMAT(MAX(met_office_weather[TEMP]), "0.0" & UNICHAR(176) & "C"),
    CALCULATETABLE (
        VALUES(met_office_weather[DATE]),
        met_office_weather[DATE] = MAX(met_office_weather[DATE])
    )
)
This filters the data to today’s date, then calculates the maximum daily temperature, followed by degree Celsius formatting.