Kevin Tsang, PhD Associate Professor UCL
Can You Beat the AI @New Scientist Live

Can you beat the AI radiologist? Have a look at these X-ray images of the lung, some of them are of healthy patients, some of them are of patients with pneumonia, and some are of patients with COVID-19. Some people at later stages of COVID-19 develop pneumonia as a complication. Pneumonia is a lung infection that causes the air sacs in the lungs... Read more 12 Oct 2024 - 1 minute read
Project: AAMOS-00
The AAMOS-00 data collection has completed with the help of our 32 participants across the UK. Together, we collected over 2,500 patient-days of data between April 2021 and June 2022 to form a rich dataset. Supported self-management empowering people with asthma to detect early deterioration and take timely action reduces the risk of asthma att... Read more 08 Jun 2023 - 1 minute read
Walmart Sales Prediction Using XGBoost

In this Notebook, I use XGBoost (a machine learning) model to predict the weekly sales at Walmart across different stores and departments. My model achieved a mean absolute percentage error of 2.36% over 7 months of hold out data. Data consists of 421570 records of weekly sales from stores spanning between “05-Feb-2010” to “26-Oct-2012”. This ... Read more 22 May 2023 - less than 1 minute read
Weather Dashboard (Power BI)

Introduction Power BI is a data visualisation tool. Here I produced a dashboard using the daily weather summaries of 2021 provided by the Met Office (based in the UK). By clicking on the different sites across the UK, you can see the weather as measured at the station. Data Processing There are two tables involved: one with the daily weathe... Read more 07 Aug 2022 - less than 1 minute read
Wordle Assistant
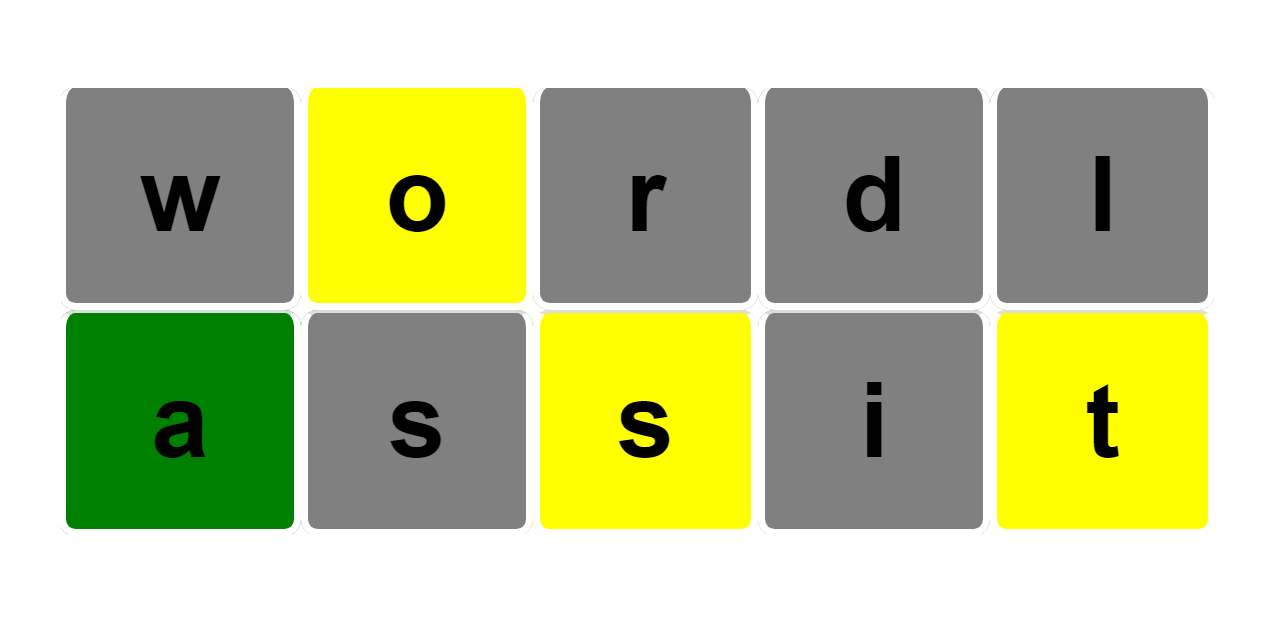
Try it yourself Click here to open the app in a new tab You can also run this app locally by running the following code in R. shiny::runGitHub("wordle_assist", "kevinchtsang") Type in your word attempts and change the colours to match (grey - no match, yellow - in word, green - correct position) by clicking on the tiles. Getting sta... Read more 09 May 2022 - 1 minute read